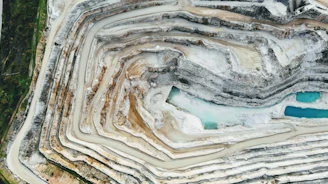
Open pit mines
Highwalls, pushbacks and haul road cuts.
 Geotech Assist
AI slope monitoring for open pit mines
Geotech Assist brings all your monitoring data into one place, highlights what’s moving and answers your questions. It works through the data. You verify and decide.
Morning summary: This morning.
12 sources read. Three Areas of Concern for your review, and two hazards updated, one with velocity up.
Area of Concern: West Wall · 40RL.
Radar 2.1 mm/day, P14 and P15 moving the same way, and tension cracks mapped on 22 Sep. All below TARP.
Area of Concern: North Pushback B.
One prism, BH-N-051, at 2.1 mm/day beside fault F3. Nothing else agrees yet, so it stays in front of you.
Area of Concern: East Highwall · 70RL.
InSAR creep of 0.8 mm a week for 14 days, and new cracks on the 21 Sep inspection. No prisms cover this wall.
Hazard update: HAZ-2026-014 · South-West Wall.
Velocity up from 1.4 to 2.6 mm/day in two days. VWP-04 behind it is the one piezometer that hasn’t dropped since the 3 Sep drains.
Pit mesh requires a local server, see README.
Open pit geotechs have more monitoring data than ever, but more sensors haven’t meant better slope outcomes. Radar, prisms, VWPs, InSAR, inspections and models each sit in their own system, and joining the dots is left to you. Geotech Assist reads them all together.
Today: the site engineer sits between a dozen separate systems, radar, prisms, InSAR, VWPs, water level sensors, inspections, geotechnical mapping, the geological and fault models, rainfall, blasting records and ad-hoc spreadsheets, and joins them up by hand.
With Geotech Assist: every source, plus any other you add, feeds Geotech Assist. It flags Areas of Concern daily, keeps engineer-verified hazards up to date and answers questions in Explore. The engineer reviews, verifies and decides.
Pits that once had a geotechnical team now run one or two engineers on a roster. Geotech Assist reads all the data every morning, so whoever comes on shift starts from the full picture, not a handover note.
The data wrangling has to happen, but it isn’t what you hired a geotech for. Geotech Assist does it, so their judgement goes into safer pits and better-optimised slopes.
Every flag, hazard and failure is kept with the data around it. Your engineers don’t have to carry it all in their heads, and when one moves on, nothing leaves with them.
Draw an area on the pit and ask in plain English. Explore works through your connected sources, or a spreadsheet you drop in, one step at a time, and hands back a map, a chart or a report. The harder the question, the more time it saves: work that used to take up to three days takes 10 to 15 minutes.
Eight prisms on the West Wall. P14 and P15, inside the Area of Concern, are the only two moving.

Sources · prism network · radar SSR‑1 · Areas of Concern
VWP‑03 is down 2.9 m since the drains went in on 3 Sep, and P01, P07 and P11 have all slowed over the same three weeks.
Sources · prisms P01, P07, P11 · VWP‑03 · drains HD‑1 to 6
F3 runs 14 m east of BH‑N‑051. That prism is the only thing moving, flat since March and 2.1 mm/day now. Radar and InSAR show nothing either side of the fault.
VWP‑05, west of F3 and behind BH‑N‑051, sits 9 m higher than VWP‑06 to the east, and the gap has grown 2 m since June. F3 looks to be holding water back on the moving side.
Yes. The 2024 failure on Pushback A released along F3. Prisms there ran at 1 to 3 mm/day for three weeks before it went.
Sources · prisms · radar SSR‑1 · InSAR · VWP‑05, VWP‑06 · fault model · hazard register
Draft ready: two pages and five figures. Check the recommendations before it goes out.
Sources · radar · prisms · inspections · geological model
Illustrative, synthetic data. Time bars are not to scale.
Geotech Assist sifts through every dataset each morning and hands you the few Areas of Concern worth your time, evidence attached. That includes slow movement below any TARP trigger, while there’s still time to act.
Why it was flagged: three sources agree, and none has reached a TARP trigger.
Why it was flagged: slow creep on InSAR and new cracks on inspection. Nothing else covers this wall yet.
Why it was flagged: one prism next to fault F3. Nothing nearby agrees yet, and it’s flagged so it isn’t missed.
Verify an Area of Concern and it becomes a hazard: engineer verified, not AI assumed. From then on Geotech Assist updates it every morning, velocity, TARP level, inspections and a short summary, and redraws the hazard map, from first movement to closure. When you make the case for a steeper pushback, the evidence is already there.
3 Areas of Concern awaiting review
Velocity up from 1.4 to 2.6 mm/day in the last two days. Still below TARP 1 at 5 mm/day. No new cracks on the 19 Sep inspection. An inspection is booked for today.
Stable. Velocity has held at about 0.4 mm/day for 21 days, well below TARP 1. The 18 Sep inspection found no change. Candidate for closure if it stays flat through October.
Carried over from the Area of Concern: radar SSR-1 at 2.1 mm/day, prisms P14 and P15 at 1.9 and 2.4, tension cracks mapped on 22 Sep. Geotech Assist updates it from tomorrow’s 05:40 run.
Carried over from the Area of Concern: 0.8 mm a week of InSAR creep for 14 days and new cracks on the 21 Sep inspection. No prisms or radar cover this wall. Geotech Assist updates it from tomorrow’s 05:40 run.
Carried over from the Area of Concern: prism BH-N-051 at 2.1 mm/day next to fault F3, with nothing else agreeing yet. Geotech Assist updates it from tomorrow’s 05:40 run.
Highwalls, pushbacks and haul road cuts.

Embankment InSAR and the weekly inspection, in one record.
Send us a few months of your monitoring history. We’ll show you what Geotech Assist would have flagged, and when, seeing only the data you had on each day.