Context is Key: Integrating Geotechnical Data for Better Decisions in Mining
All Data in One Place: How Geotech Assist Brings Context Together
Richard Shellam
8/1/20257 min read
Imagine a geotechnical engineer at a mine site looking at a single time-series chart of ground movement for one monitoring point. The x-axis is time and the y-axis is deformation or displacement. For a long period, the chart was flat – indicating stable ground – but recently it has started to creep upward. It’s a subtle increase, not yet an alarming exponential rise. What does this mean? Is the slope or wall starting to fail, or is it a minor, localized movement?
The Challenge: Judging Risk from a Single Chart
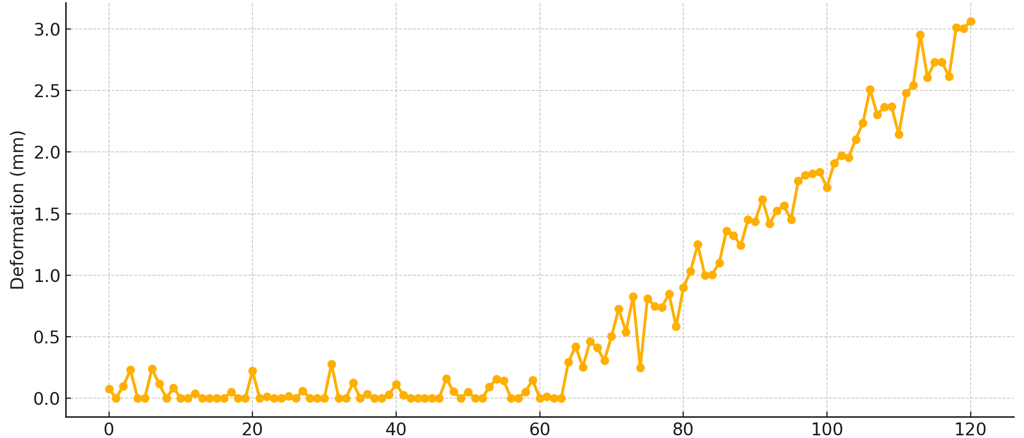
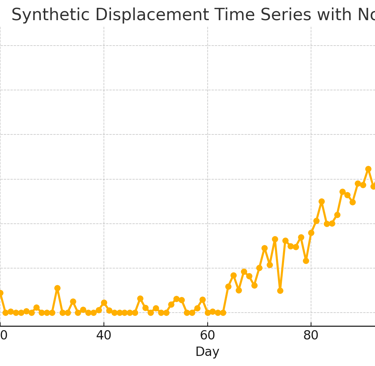
Figure: Synthetic example of a displacement time series for a monitoring prism. The deformation was flat (stable) for a long period, then around day 70 a noticeable upward trend begins. An engineer must interpret whether this slow increase is an early warning sign of instability or not. (Synthetic data for illustration.)
Currently, many engineers are forced to make judgment calls based on isolated charts like this. They monitor instruments such as prisms or radar, and when a trend appears, they must decide if it signals a potential hazard. This approach can be time-consuming and stressful, especially under pressure to ensure safety. In fact, much of an engineer’s time can be eaten up by manual data handling – one report notes that engineers spend up to 70% of their time just processing and compiling monitoring data instead of actually analysing stability risks.
This manual process involves transcribing readings, plotting graphs, and cross-checking various sources by hand, which not only slows down critical safety decisions but also leaves room for human error. Furthermore, most monitoring programs today remain fragmented – focused on one instrument or data source at a time – and lack the capability for multi-source data integration and analysis. It’s like trying to understand a complex story by reading only one chapter; you might miss the broader context.
Piecing Together the Full Picture (Manually)
When that prism’s chart starts trending upward, a diligent engineer will gather additional context before sounding the alarm. This often means manually cross-checking many different pieces of information, such as:
Location and Nearby Instruments: Where exactly is this prism? The engineer will locate it on the mine plan or 3D model, then check if nearby prisms or radar points are showing similar movement. If other instruments in the vicinity are also trending upward, it suggests a wider area of instability.
Site History and Geology: The engineer recalls or researches the site’s geological model. What rock type or structure is this prism installed in? For example, if it’s in a highly weathered granite known to be weak, that adds to concern. They also consider if there have been previous instability events or failures in that area in the past – digging through records or personal knowledge to compare the current trend with historical patterns.
Inspections and Reports: They might phone a colleague or search inspection logs to see if anyone reported visible signs like tension cracks or ground water seepage near that location. A recent field inspection might note “small tension cracks developing on the crest,” which would corroborate the movement seen in the data.
Environmental Factors: Is there heavy rainfall lately? Changes in water pressure (from piezometers measuring groundwater) or blasting activities could explain short-term movement. The engineer might pull data from rain gauges or piezometer readings to see if there’s a spike that coincides with the deformation trend.
Current Operations: They consider mine operations – for instance, nearby excavation or blasting, which could destabilise the area. Sometimes operational changes cause gradual movements that need monitoring.
All these data points – instrument readings, geological information, inspection notes, environmental and operational data – form pieces of a puzzle. Manually compiling them is labour-intensive and slow, often involving flipping between different software, spreadsheets, and paper reports. In the past, geotechnical monitoring data management was largely manual (think copying numbers into spreadsheets and plotting simple charts), a process prone to delays and errors. An engineer might spend hours (or days!) gathering this context, time during which the clock is ticking on a potential failure. Delays of even a day or two in interpreting data can erode the benefit of “early warning”. Moreover, without a unified view, it’s hard to correlate all the inputs – important clues can be overlooked when data lives in separate silos.
All Data in One Place: How Geotech Assist Brings Context Together
Geotech Assist is designed to solve exactly this problem by providing a unified platform for geotechnical monitoring data. Instead of the engineer scrambling to gather information from various sources, the system automatically integrates all relevant data and presents it in context. This means when you look at that same prism’s rising deformation trend in Geotech Assist, you also immediately see a wealth of related information, for example:
Nearby Sensor Correlations: The platform links data from nearby prisms, radar monitoring points, and InSAR pixels. If the prism at location X is moving, you’ll see if the radar data in that area shows a similar uptick, or if satellite-based deformation over the long term has detected slow creep in that zone. Such multi-sensor integration gives a more comprehensive overview of ground stability rather than a single data stream.
Geological and Structural Models: Geotech Assist can integrate 3D geological models and structural models. When an anomaly is detected, the system shows the rock unit at that location – e.g., the prism is in a zone of weathered granite or intersecting a known fault structure. This matters because different materials and structures have different stability characteristics. Knowing the geology instantly provides context on how concerning a given movement might be. If the movement is in a weak layer that has caused trouble before, it raises the risk profile.
Inspection Records and Field Notes: Because the platform is spatially aware, it can pull up any inspection reports or maintenance records tied to the location. For instance, if a geotechnician logged an inspection in that area last week noting “new cracks 5mm wide observed,” Geotech Assist will flag and display that note alongside the instrument data. Similarly, any photos or drone imagery of the site can be linked for visual confirmation of conditions. This replaces the need to dig through files or call colleagues – the information is automatically linked by location and time.
Hydrological Data: If your site uses vibrating wire piezometers or other water-level sensors, those can be integrated as well. Rising pore-water pressure often precedes slope failures by reducing effective stress. Geotech Assist can show the water level trend in the area of interest, alerting you if increased groundwater might be contributing to the movement. Rainfall data or slope drainage flow rates can likewise be included for environmental context.
Past Event History: One of the most powerful features is the ability to quickly review historical events in the system. Geotech Assist maintains a database of all logged incidents or alerts. If there were prior instances of movements or small failures near this prism, the platform can surface a summary: e.g., “June 2022 – 15 mm movement over 2 weeks; no failure occurred.” Knowing how previous events progressed (did they stabilise, or did they lead to a collapse?) and what actions were taken provides invaluable insight. In other words, the system serves as the institutional memory of ground behavior on your site.
Custom Data Sources: Every mine has unique monitoring datasets, and Geotech Assist is built to be flexible. Any dataset that has a spatial component (for example, a DXF file) can be integrated. The platform can be tailored to bring in site-specific data that you find relevant. The goal is to make sure nothing useful sits in a disconnected silo. All the data layers overlay in one interactive 3D map and timeline, so you are truly seeing the situation from all angles.
By having all this information in one place, Geotech Assist ensures you are no longer “comparing apples to oranges” when assessing a potential hazard. Instead of staring at one graph and guessing, you get a holistic, contextual view of the area in question. Research has shown that monitoring data integrated from multiple sources can fully capture the true deformation characteristics and risk of geotechnical hazards. In practice, this means fewer blind spots.
From Monitoring to Action: Smarter Hazard Identification
Having all the data at your fingertips is a game changer, but Geotech Assist goes one step further: it analyzes the data for you. The platform employs custom algorithms (leveraging techniques in AI) to sift through the sea of time-series data and spatial information, flagging what is anomalous. Instead of merely plotting data, it interprets it to a degree, providing an engineer with a concise summary of the situation.
For example, the system would generate an event summary like:
“Prism P7 has accelerated from ~0 mm/month to 2 mm/week over the past 10 days. Nearby radar pixels shows a concurrent 3 mm of movement in the same period. The prism is located in weathered granite on the west wall. Two inspections in this area (Mar 5 and Mar 12) noted new tension cracks. Piezometer PX-3, 50 m away, recorded a 1.2 m rise in water level after heavy rains last week.
Three past events within 100 m (in 2019, 2021, 2022) were identified; none progressed beyond 20 mm displacement
All of that information would have taken a human hours to compile, but the system can do it in seconds. By bringing analysis into the platform, Geotech Assist is moving beyond pure monitoring into the realm of decision support. It’s not making the decision for you, but it gives you organised facts and insights to make that decision confidently.
The bottom line is that with comprehensive data and automated analysis, engineers can focus on engineering – interpreting the results and choosing the best course of action – rather than crunching numbers or chasing down information.
Better Decisions, Safer Operations
In summary, having that slight deformation trend on a prism is not a cause for panic – if you can quickly determine its significance. Geotech Assist arms geotechnical engineers with the context and confidence they need to answer the critical question: “Is this a problem? How urgent is it?” By unifying prisms, radar, InSAR, piezometers, geological models, inspections, and more into one platform, you get an immediate 360° view of any potential issue. This integrated approach saves precious time (no more digging through disparate records) and reduces the chance of missing a warning sign. It moves the monitoring process from reactive “watching and worrying” to proactive risk management. When data flows seamlessly into a single source of truth, your team can detect hazards earlier and make informed decisions faster. Ultimately keeping people safe and operations running smoothly.
Geotech Assist is all about bringing context to your data and clarity to your decisions. Instead of working in the dark with isolated information, you’ll be empowered by a spotlight that shows the whole scene. It’s a shift from monitoring for its own sake, to monitoring with meaning and insight.
Ready to move beyond isolated charts and elevate your mine’s geotechnical safety?
Contact us to learn more about Geotech Assist or book a demo to see how all your data can come together in one place. With the right tools, even the smallest trend can be understood in context – and that makes all the difference in keeping your mine safe and productive.
Geotech Assist
AI with Engineering Oversight
© 2024. All rights reserved.